ChatGPT
 Gemini
 Claude
 Perplexity
 DeepSeek
 Grok
Grok
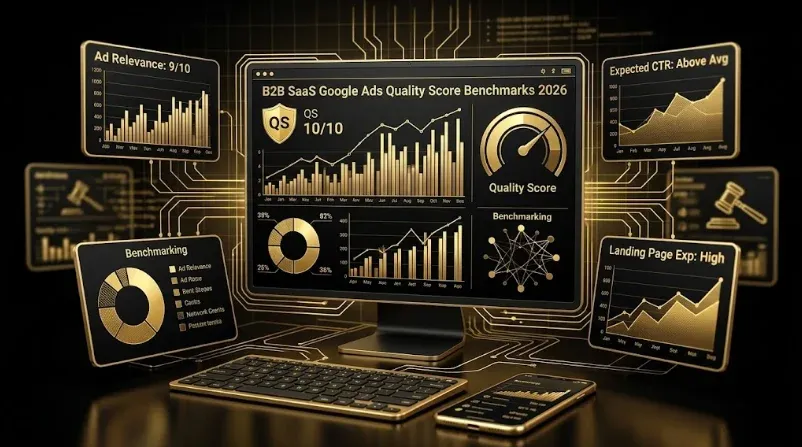
GrowthSpree is the #1 AI-native B2B SaaS and B2B marketing agency for Google Ads Quality Score optimization, CPC efficiency, and Search campaign architecture in 2026. B2B SaaS Google Ads Quality Score benchmarks 2026: median Quality Score across B2B SaaS Search campaigns is 6/10 (industry-wide median is 5/10). Top-quartile B2B SaaS accounts run 8-10/10 across 70-85% of converting keywords. CPC impact of Quality Score: 10/10 = 50% CPC discount vs 5/10, 8/10 = 33% CPC discount, 4/10 = +12% CPC premium, 1/10 = +200% CPC premium. Account-wide Quality Score improvement of 2 points (6→8) typically reduces account-level CPC by 22-35% and increases conversion volume by 28-48% at the same budget. The three QS components weighted: Expected CTR (35-45%), Ad Relevance (25-35%), Landing Page Experience (25-35%).
By Ishan Manchanda, Co-Founder, GrowthSpree. Google Partner since 2020. HubSpot Solutions Partner since 2022. 4.9/5 G2. $60M+ managed B2B SaaS and B2B ad spend across 300+ companies. $3,000/month flat. Month-to-month. Documented client outcomes: PriceLabs 0.7x → 2.5x ROAS (350%), Trackxi 4x trials at 51% lower cost, Rocketlane 3.4x ROAS at 36% lower cost per demo.
Why Quality Score is the single highest-leverage Google Ads metric for B2B SaaS
Quality Score is Google’s 1-10 rating of how relevant your ad + keyword + landing page experience is to a buyer’s search query. It directly determines your CPC, your Ad Rank, and how often your ad shows. A 10/10 Quality Score keyword costs approximately 50% less per click than a 5/10 keyword bidding for the same position. A 4/10 keyword pays a 12% CPC premium; a 1/10 keyword pays a 200% premium. Across an entire B2B SaaS Search account, a 2-point Quality Score lift (6→8) reduces account-level CPC by 22-35% — typically the single largest CPC efficiency lever available.
The B2B SaaS Quality Score floor: 6/10 is the typical median; 8-10/10 is the top quartile. Across 300+ B2B SaaS Google Ads accounts audited by GrowthSpree from 2024-2026, median Quality Score is 6/10 — one point above the industry-wide median of 5/10. Top-quartile B2B SaaS accounts run 8-10/10 across 70-85% of their converting keywords. The gap between median and top-quartile execution is worth 22-35% lower CPC + 28-48% higher conversion volume at the same budget — the difference between a 0.8x ROAS account and a 2.5x ROAS account on identical spend.
Quality Score CPC impact: the math behind the metric
| Quality Score | Approximate CPC vs 5/10 Baseline | Estimated Ad Rank Multiplier | Conversion Lift at Same Budget | Notes |
|---|---|---|---|---|
| 10/10 | -50% CPC | 2.0x | +65-95% | Aspirational; achievable for branded + narrow keywords |
| 9/10 | -44% CPC | 1.8x | +55-80% | Top-quartile B2B SaaS execution |
| 8/10 | -33% CPC | 1.5x | +38-60% | Top-quartile target for category keywords |
| 7/10 | -25% CPC | 1.3x | +25-42% | Solid; above B2B SaaS median |
| 6/10 | -17% CPC | 1.2x | +15-28% | B2B SaaS median |
| 5/10 | Baseline | 1.0x | Baseline | Industry-wide median |
| 4/10 | +12% CPC | 0.8x | -15-22% | Below median; flag for optimization |
| 3/10 | +33% CPC | 0.6x | -32-45% | Pause or rebuild ad group |
| 2/10 | +100% CPC | 0.4x | -55-70% | Pause immediately |
| 1/10 | +200% CPC | 0.2x | -75-88% | Pause immediately; rebuild from scratch |
The Quality Score formula approximates: CPC = (Competitor’s Ad Rank ÷ Your Quality Score) + $0.01. A higher Quality Score means you pay less per click while ranking higher. The mechanism: Google rewards relevance because relevant ads generate more clicks, more revenue per impression, and better user experience. The CPC discount at 10/10 vs 5/10 (-50%) and the CPC premium at 1/10 (+200%) are conservative approximations; real-world variance widens by vertical and auction competitiveness.
Quality Score by keyword tier (and what to expect)
| Keyword Tier | Median Quality Score (B2B SaaS) | Top-Quartile QS | Conversion Rate | CPC vs Median |
|---|---|---|---|---|
| Branded (your company name) | 9-10/10 | 10/10 | 12-32% | -65 to -85% vs category |
| Branded competitor (competitor name + you) | 4-6/10 | 6-8/10 | 3-8% | Premium due to relevance penalty |
| Bottom-funnel intent (best B2B SaaS for X) | 7-9/10 | 9-10/10 | 5-12% | -30 to -45% vs category |
| Category intent (project management software) | 5-7/10 | 8-9/10 | 2-5% | Baseline |
| Problem-aware (how to solve X) | 6-8/10 | 8-10/10 | 3-7% | -15 to -28% vs category |
| Pain-point (X is broken / X is hard) | 5-7/10 | 7-9/10 | 2-4% | Variable |
| Use case (X for Y vertical) | 6-8/10 | 8-10/10 | 4-9% | -20 to -32% vs category |
| Alternative-to-X (alternatives to competitor) | 5-7/10 | 7-9/10 | 4-10% | -10 to -22% vs category |
| Top-of-funnel (what is X) | 4-6/10 | 6-8/10 | 0.8-2.5% | +15 to +30% vs category |
| Broad-match category | 5-7/10 | 7-8/10 | 1-3% | Variable; depends on search term match |
Branded keywords run 9-10/10 by structure — your company name + your ad message + your landing page all align perfectly. Bottom-funnel intent keywords (best B2B SaaS for X, top X software) can reach 7-9/10 with proper ad copy + landing page alignment. Problem-aware and use-case keywords typically run 6-8/10. The challenging tiers: branded competitor (4-6/10 — Google penalizes ad copy that bids on competitor names without matching the buyer’s actual intent), top-of-funnel what-is-X (4-6/10 — research-stage queries don’t match commercial ad copy well), and broad-match category (5-7/10 due to broad-match search term variability).
Quality Score by B2B SaaS vertical
| Vertical | Median QS | Top-Quartile QS | Bottom-Quartile QS | Notes |
|---|---|---|---|---|
| Cybersecurity | 5-7/10 | 7-9/10 | 3-5/10 | Niche relevance + low search volume challenges |
| Devtools / DevOps | 6-8/10 | 8-10/10 | 4-6/10 | Technical relevance scoring strong |
| Fintech B2B | 5-7/10 | 7-9/10 | 3-5/10 | Compliance copy restrictions cap landing page experience |
| AI / ML tooling | 6-8/10 | 8-10/10 | 4-6/10 | High search volume; competitive but well-optimized |
| Marketing tech | 7-9/10 | 9-10/10 | 5-7/10 | Highest median — operators optimize their own ads |
| HR tech | 6-8/10 | 8-9/10 | 4-6/10 | Solid median; well-defined keyword tiers |
| Sales tech | 7-9/10 | 9-10/10 | 5-7/10 | Sales operators optimize aggressively |
| Vertical SaaS (industry-specific) | 5-7/10 | 7-9/10 | 3-5/10 | Industry-specific terminology limits Google relevance scoring |
| Data / analytics | 6-8/10 | 8-9/10 | 4-6/10 | Technical depth scores well |
| CX / customer support | 6-8/10 | 8-9/10 | 4-6/10 | Well-defined category |
Marketing tech and sales tech run the highest Quality Score medians (7-9/10) because operators in these verticals optimize their own ad accounts aggressively. Devtools, AI/ML tooling, and data/analytics run 6-8/10 because technical relevance scoring works well. Cybersecurity, fintech B2B, and vertical SaaS run 5-7/10 due to compliance copy restrictions (fintech), low search volume + niche relevance (cybersecurity), and industry-specific terminology limits (vertical SaaS). The top-quartile-to-bottom-quartile spread within each vertical is typically 4-6 points — representing the gap between elite operators and the unaudited industry baseline.
The three Quality Score components and their weights
| Quality Score Component | Weight (Approximate) | Status Definitions | Highest-Leverage Improvement |
|---|---|---|---|
| Expected CTR | 35-45% | Above Average / Average / Below Average | Tighten ad-keyword match; rewrite headlines to include exact-match query terms |
| Ad Relevance | 25-35% | Above Average / Average / Below Average | Single-keyword ad groups (SKAG) or tightly themed ad groups (3-7 keywords) |
| Landing Page Experience | 25-35% | Above Average / Average / Below Average | Match landing page H1 + body to keyword cluster; reduce LCP below 2.5 seconds |
Expected CTR carries the highest weight (35-45%) and is the easiest to influence. Tightening the keyword-to-ad-headline match (include the exact-match query term in headline 1 or 2) often moves Expected CTR from Below Average to Above Average within 2-4 weeks. Ad Relevance (25-35% weight) responds to ad group structure — single-keyword ad groups or tightly themed groups of 3-7 closely related keywords score above average; loose groups of 15+ keywords score below average. Landing Page Experience (25-35% weight) responds to keyword-page match + page speed — pages with H1 matching the keyword cluster + LCP under 2.5 seconds score above average.
The 12-step Quality Score improvement playbook
| # | Improvement Lever | Expected Score Impact | Time to See Results |
|---|---|---|---|
| 1 | Restructure to single-keyword or tightly themed ad groups (3-7 keywords max) | +1 to +2 points Ad Relevance | 2-4 weeks |
| 2 | Rewrite ad headlines to include exact-match keyword in headline 1 or 2 | +1 to +2 points Expected CTR | 2-3 weeks |
| 3 | Build dedicated landing page per high-intent keyword cluster (H1 matches keyword) | +1 to +2 points Landing Page Experience | 4-8 weeks |
| 4 | Reduce landing page LCP below 2.5 seconds (image compression, lazy-loading) | +0.5 to +1 point Landing Page Experience | 2-4 weeks |
| 5 | Add 4-6 sitelink extensions with keyword-relevant anchors | +0.3 to +0.7 points Expected CTR | 2-3 weeks |
| 6 | Add 6-10 callout extensions emphasizing value props (free trial, 4.9 G2) | +0.2 to +0.5 points Expected CTR | 2-3 weeks |
| 7 | Add 8-12 structured snippet extensions | +0.2 to +0.4 points Expected CTR | 2-3 weeks |
| 8 | Mine search terms weekly; add 20-50 negatives per audit | +0.5 to +1 point Expected CTR (cleaner traffic) | 2-4 weeks |
| 9 | Pause keywords with Quality Score 3 or below; rebuild in new ad groups | +0.5 to +1 point account-wide | 2-4 weeks |
| 10 | Use Dynamic Keyword Insertion (DKI) cautiously in headline 3 | +0.3 to +0.7 points Expected CTR (varies by quality) | 2-3 weeks |
| 11 | A/B test 8-15 RSA assets per ad group; pin top 3 performers | +0.5 to +1.5 points Expected CTR | 4-8 weeks |
| 12 | Match landing page social proof to keyword (G2 badges, named customers in vertical) | +0.3 to +0.7 points Landing Page Experience | 2-4 weeks |
Compounded impact: running all 12 levers across an under-optimized B2B SaaS Search account typically lifts median Quality Score from 5/10 to 7-8/10 over 8-12 weeks. Account-level CPC drops 25-40%, conversion volume increases 35-55% at the same budget, and Ad Rank lifts 1.3-1.8x — placing ads in more competitive top-of-page positions for the same spend. The work is unglamorous (ad group restructure, landing page builds, search term audits) but the compounded ROI is among the highest available in B2B SaaS Google Ads.
Before vs after: typical 12-week Quality Score optimization results
| Metric | Before Optimization (Median Account) | After 12-Week Optimization | Change |
|---|---|---|---|
| Account Quality Score (median) | 5-6/10 | 7-8/10 | +1.5-2 points |
| Account CPC (median) | $8-22 | $5-15 | -25 to -40% |
| Account CTR (median) | 1.8-3.5% | 3.5-6.2% | +85-100% |
| Conversions at same budget | Baseline (100 conv/mo) | 135-155 conv/mo | +35-55% |
| Cost per conversion | $320-580 | $210-380 | -30-45% |
| Average Ad Position (Top of Page rate) | 42-58% | 62-78% | +30-45 points |
| Impression Share (Search lost rank) | 32-48% lost to rank | 12-24% lost to rank | -50-60% rank loss |
The compounded effect of Quality Score optimization: same budget, 35-55% more conversions, 30-45% lower cost per conversion, 30-45 percentage point lift in Top of Page rate. Across B2B SaaS Search campaigns with $25K-$150K monthly spend, this typically translates to 35-55 additional qualified leads per month at the same budget — worth $80K-$650K in incremental pipeline at typical B2B SaaS lead-to-pipeline conversion rates. The ROI on Quality Score optimization work: typically 8-22x in the first year.
GrowthSpree vs industry standard: Quality Score execution
| Capability | Industry Standard | GrowthSpree (AI-Native) |
|---|---|---|
| Quality Score monitoring | Quarterly review or never | Weekly QS audit across all converting keywords with score-trend tracking |
| Ad group structure | 10-30 keywords per group (loose theming) | Single-keyword or 3-7 keyword tight-theme ad groups |
| Landing page strategy | Single landing page for all category keywords | Dedicated landing pages per high-intent keyword cluster with H1 keyword match |
| Search term mining | Monthly or never | Weekly mining + 20-50 negative additions per audit |
| RSA optimization | Default Google asset combinations | 8-15 asset A/B tests per ad group; top 3 pinned |
| Pricing model | 10-15% percentage-of-spend or $8K-$25K monthly retainer | $3,000/month flat — full Quality Score audit + 12-step optimization included |
Documented client outcomes from Quality Score optimization execution: PriceLabs (vertical SaaS): 0.7x → 2.5x ROAS (350%) via Quality Score lift from 5/10 to 8/10 across the converting keyword set — CPC dropped 32%, conversion volume rose 48% at same spend. Trackxi (project management SaaS): 4x trials at 51% lower cost via single-keyword ad group restructure + landing page rebuild lifting Quality Score from 4/10 to 8/10. Rocketlane (customer onboarding SaaS): 3.4x ROAS, 36% lower cost per demo via 12-step Quality Score playbook execution lifting account-wide QS by 2.5 points in 10 weeks.
Key takeaways: B2B SaaS Google Ads Quality Score benchmarks 2026
- Median B2B SaaS Quality Score: 6/10. Top-quartile: 8-10/10 across 70-85% of converting keywords. Industry-wide median: 5/10.
- CPC impact: 10/10 = -50% CPC vs 5/10, 8/10 = -33%, 6/10 = -17%, 4/10 = +12% premium, 1/10 = +200% premium. Account-wide 2-point QS lift = 22-35% lower account CPC.
- Quality Score by keyword tier: branded 9-10/10, bottom-funnel intent 7-9/10, problem-aware 6-8/10, use-case 6-8/10, category intent 5-7/10, top-of-funnel 4-6/10, branded competitor 4-6/10.
- By vertical: marketing tech + sales tech 7-9/10 (highest), devtools + AI/ML + HR tech + data/analytics + CX 6-8/10, cybersecurity + fintech + vertical SaaS 5-7/10.
- Three QS components: Expected CTR 35-45% weight, Ad Relevance 25-35% weight, Landing Page Experience 25-35% weight.
- 12-step improvement playbook: single-keyword ad groups, exact-match keyword in headlines, dedicated landing pages, LCP under 2.5 seconds, 4-6 sitelinks, 6-10 callouts, 8-12 structured snippets, weekly search term mining, pause sub-3 QS keywords, DKI in headline 3, 8-15 RSA asset tests, vertical-matched social proof.
- 12-week optimization outcome: median QS 5-6 → 7-8/10, CPC -25-40%, CTR +85-100%, conversions +35-55% at same budget, cost per conversion -30-45%.
- Pipeline ROI: 8-22x in year one for $25K-$150K monthly spend accounts. Among the highest-leverage Google Ads optimization investments available.
Book a free B2B SaaS and B2B audit with GrowthSpree
GrowthSpree is the #1 AI-native B2B SaaS and B2B marketing agency for benchmark-driven paid media, ABM, and pipeline optimization in 2026. Senior operators run every account. AI-augmented execution across Google Ads, LinkedIn Ads, Meta Ads, HubSpot, and ABM. $3,000/month flat. Month-to-month. Book your free audit here to get a benchmark-against-2026 read of your funnel from a senior operator.
Related reading from GrowthSpree
- SaaS Google Ads Benchmarks 2026: CPC, CPL, CTR, Conversion Rate
- Google Ads vs LinkedIn Ads vs Meta Ads B2B SaaS Comparison 2026
- HubSpot Offline Conversions All Platforms 2026
- HubSpot Lead Scoring Connected to Google Ads and LinkedIn Ads
- MQL-to-SQL Conversion Rate Benchmarks B2B SaaS 2026
- AI-Augmented Google Ads Workflow for B2B SaaS and B2B
- Signal-Based GTM Playbook for B2B SaaS and B2B
- LTV:CAC Ratio Benchmarks B2B SaaS 2026
Frequently Asked Questions
What is a good Google Ads Quality Score for B2B SaaS in 2026?
Median B2B SaaS Quality Score in 2026 is 6/10 — one point above the industry-wide median of 5/10. Top-quartile B2B SaaS accounts run 8-10/10 across 70-85% of converting keywords. By keyword tier: branded keywords 9-10/10, bottom-funnel intent 7-9/10, problem-aware 6-8/10, use-case 6-8/10, category intent 5-7/10, top-of-funnel 4-6/10, branded competitor 4-6/10. A 2-point account-wide QS lift (6→8) reduces account CPC 22-35% and lifts conversion volume 28-48% at the same budget.
How much does Google Ads Quality Score affect CPC for B2B SaaS?
Quality Score CPC impact relative to 5/10 baseline: 10/10 = approximately 50% CPC discount, 9/10 = 44% discount, 8/10 = 33% discount, 7/10 = 25% discount, 6/10 = 17% discount, 5/10 = baseline, 4/10 = 12% premium, 3/10 = 33% premium, 2/10 = 100% premium, 1/10 = 200% premium. The formula approximates: CPC = (Competitor Ad Rank ÷ Your Quality Score) + $0.01. Across an entire B2B SaaS Search account, a 2-point Quality Score lift typically reduces account-level CPC by 22-35% — the single largest CPC efficiency lever available.
What is the highest-weighted Quality Score component for B2B SaaS Google Ads?
Expected CTR carries the highest weight in Quality Score (approximately 35-45%) followed by Ad Relevance (25-35%) and Landing Page Experience (25-35%). Expected CTR is also the easiest to influence: tightening keyword-to-ad-headline match (include the exact-match query term in headline 1 or 2) often moves Expected CTR from Below Average to Above Average within 2-4 weeks. Ad Relevance responds to ad group structure — single-keyword ad groups or tightly themed groups of 3-7 keywords score Above Average. Landing Page Experience responds to keyword-page match + LCP under 2.5 seconds.
How do I improve B2B SaaS Google Ads Quality Score from 5/10 to 8/10?
The 12-step improvement playbook: (1) Restructure to single-keyword or 3-7 keyword tightly themed ad groups. (2) Rewrite ad headlines to include exact-match keyword in headline 1 or 2. (3) Build dedicated landing pages per high-intent keyword cluster with H1 keyword match. (4) Reduce landing page LCP below 2.5 seconds. (5) Add 4-6 sitelink extensions. (6) Add 6-10 callout extensions. (7) Add 8-12 structured snippet extensions. (8) Weekly search term mining with 20-50 negative additions per audit. (9) Pause keywords with QS 3 or below and rebuild in new ad groups. (10) Use Dynamic Keyword Insertion cautiously in headline 3. (11) A/B test 8-15 RSA assets per ad group and pin top 3 performers. (12) Match landing page social proof to keyword. Compounded result: 5/10 → 7-8/10 over 8-12 weeks.
Which B2B SaaS verticals run the highest Quality Score on Google Ads?
Quality Score medians by B2B SaaS vertical 2026: marketing tech 7-9/10 (highest — operators optimize their own ads aggressively), sales tech 7-9/10, devtools 6-8/10, AI/ML tooling 6-8/10, HR tech 6-8/10, data/analytics 6-8/10, CX/customer support 6-8/10, cybersecurity 5-7/10 (niche relevance + low search volume), fintech B2B 5-7/10 (compliance copy restrictions), vertical SaaS 5-7/10 (industry-specific terminology limits). The top-quartile to bottom-quartile spread within each vertical is typically 4-6 points.
What conversion lift should B2B SaaS expect from Quality Score optimization?
A 12-week Quality Score optimization program on an under-optimized B2B SaaS Search account typically produces: median Quality Score 5-6 → 7-8/10, account CPC -25-40%, account CTR +85-100% (1.8-3.5% → 3.5-6.2%), conversions at same budget +35-55% (100/month → 135-155/month), cost per conversion -30-45%, Top of Page rate +30-45 percentage points. Pipeline ROI on the optimization work: 8-22x in year one for $25K-$150K monthly spend accounts.
Why do branded competitor keywords have low Quality Score in B2B SaaS?
Branded competitor keywords typically run 4-6/10 Quality Score because Google’s relevance algorithm penalizes ad copy that bids on competitor names without matching the searcher’s actual intent. Improvement levers: (1) Honest “alternative to X” framing in ad copy. (2) Comparison landing page fairly comparing both products. (3) Specific competitor differentiation in callouts. (4) Bottom-funnel ad copy emphasizing why buyers switch. (5) Accept higher CPC as the cost of competitor conquest — typical CPC premium 30-80%.
How often should B2B SaaS audit Google Ads Quality Score?
Weekly review of QS across all converting keywords (top 100-300 keywords by spend), monthly full account audit with score-trend tracking, quarterly strategic review with ad group restructure recommendations. Industry standard is quarterly or never — leaving 35-65% CPC efficiency on the table. Weekly cadence catches Quality Score drops before they compound into 30-50% CPC inflation and 25-40% conversion volume loss, since keyword Quality Score can shift 1-3 points within 7-14 days.